
Challenge: How would you construct a Decency-Adjusted Economic Cost (DAEC) metric . . . in ways that Finance + Planners . . . and the Public can easily understand the costs?
- Purpose: put a credible €uro-value on the actual time “invested” during Commuting . . .
- Core idea: cost = people affected × delay minutes × EU Value-of-Travel-Time (VTT) x biocapacity compromised . . .
- Reference: the EU’s “value of travel time” tables . . .
- The Decency-Adjusted Economic Mobility Cost is a mirror . . . that shows how we value our time, our mobility, our streets, our air+ . . . and our people.
- What would your Decency-Adjusted Economic Cost (DAEC) metric look like? Strive to keep it intuitive and policy-relevant. For example, how would you construct and incorporate tools including:
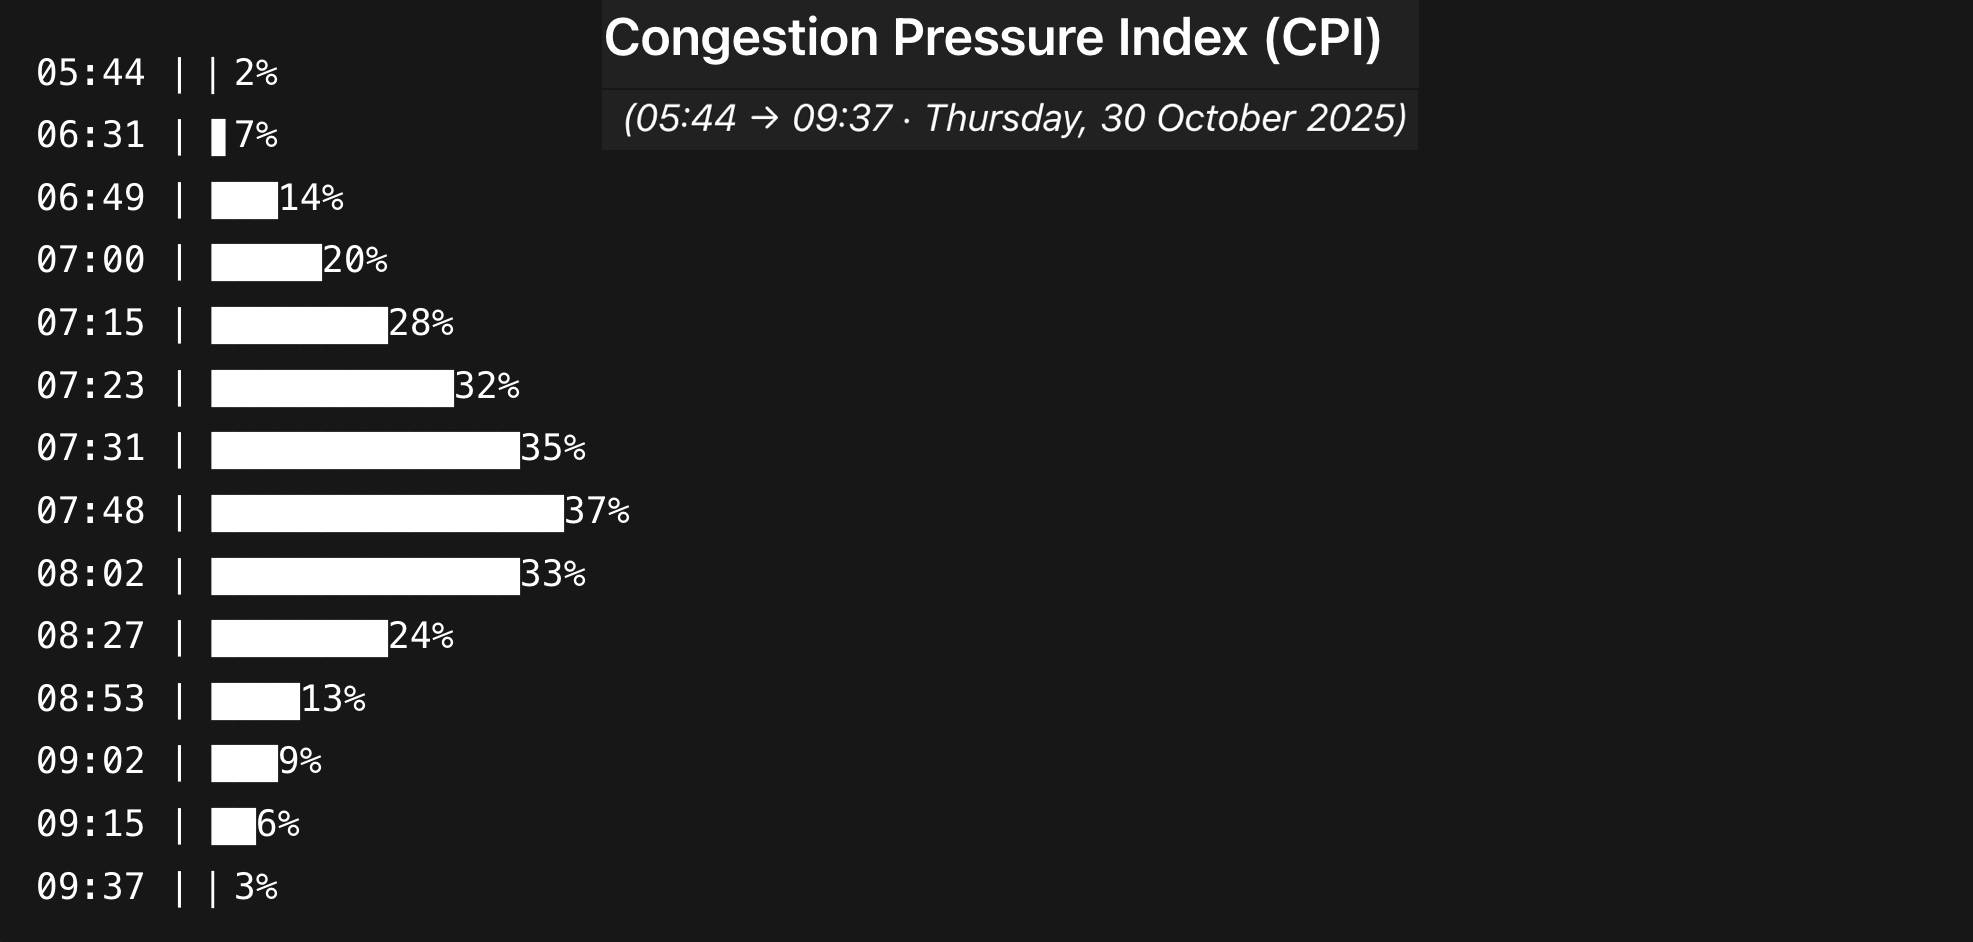
- CPI (Congestion Pressure Index): share of network in slow/stop-and-go that shows the size and duration of the morning wave . . . and not just hot-spots.
- Modal Opportunity Rate: the share of observed delays on corridors where a safe bicycle route or tram line could absorb trips today.
- “Congestion” as Addressable Demand.
- Economic Cost per Delay Minute: a holistic €/hourly algorithm that makes the costs understandable to finance and non-finance audiences.
- Emission Intensity (proxy CO₂e/min delay): congestion-adjusted carbon burden, expressed as a percentage above baseline, highlighting how short-lived peaks can still magnify emissions on cold-start corridors.
Let’s look at Thursday, 30th October 2025’s Congestion Pressure Index (CPI) and 15 traffic delays’ snapshots:
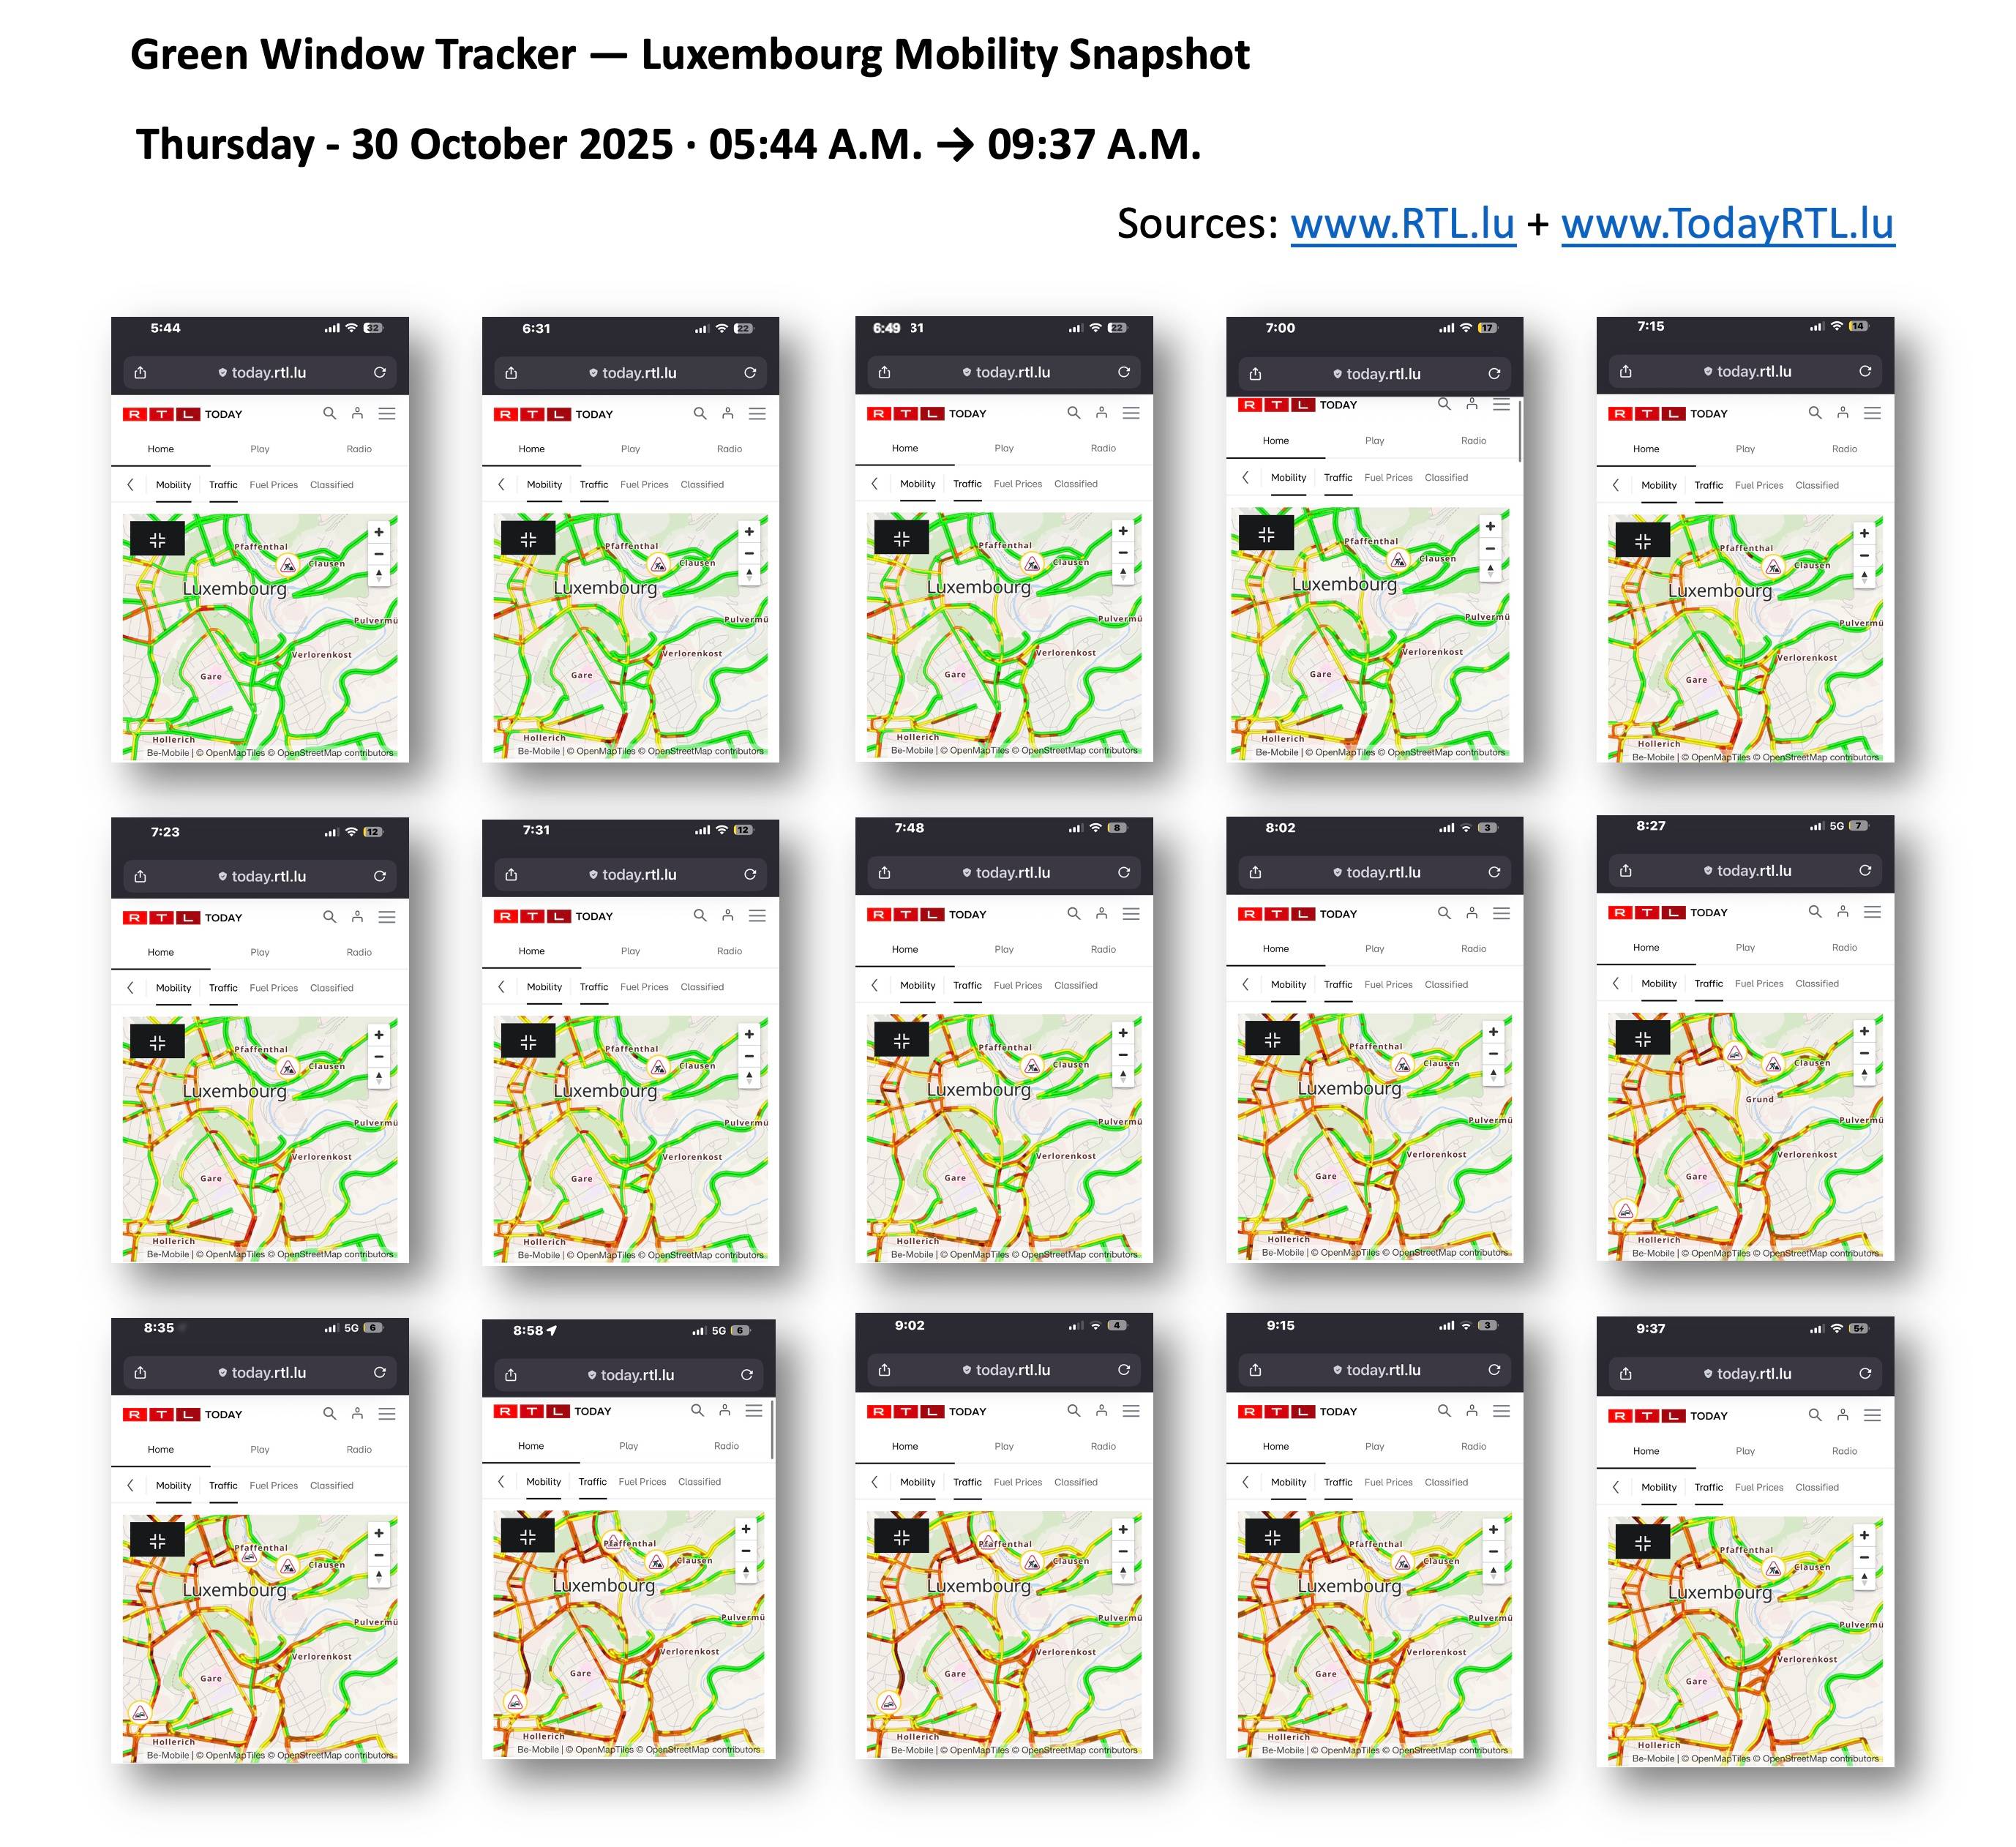
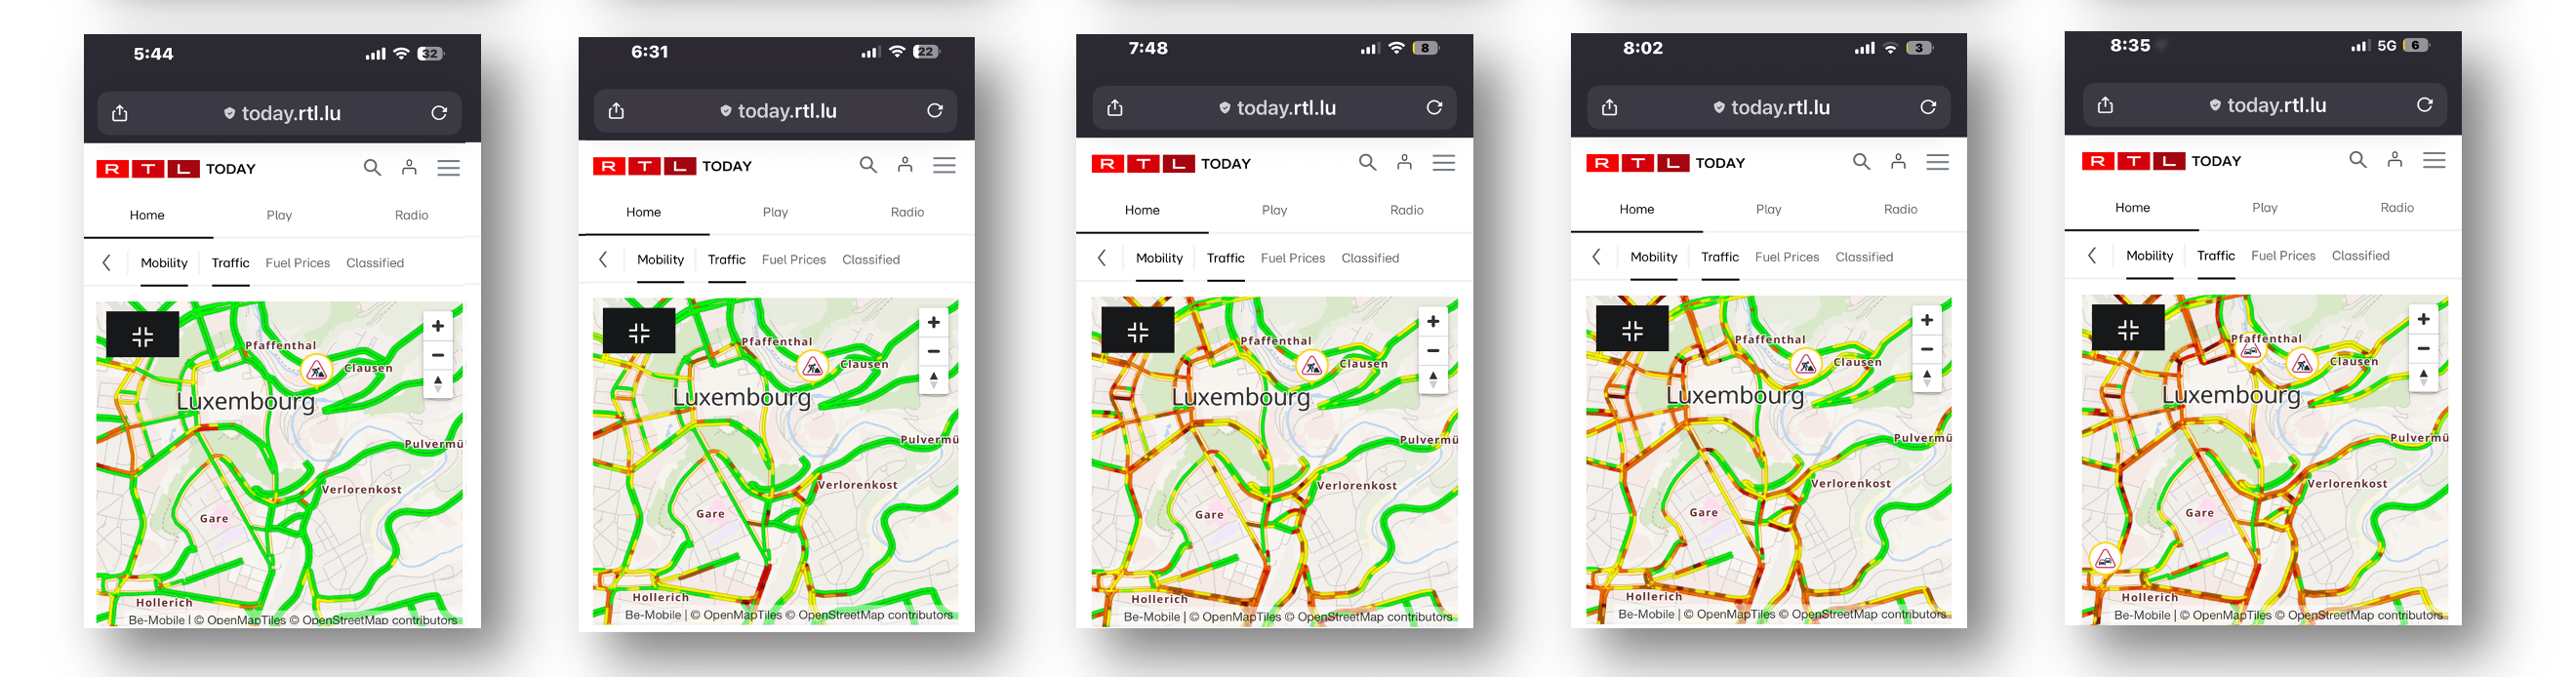
The 15 Congestion Pressure Wave snapshots:
05:44 A.M. Network Awakening
The first measurable movement begins; scattered slowdowns on approach corridors to the capital. No major compression yet, but early friction zones form along the A6 and N4.
Network Overview
🛑 Incidents: 0
⏱ Total delay: ≈ 3 min
📏 Congested distance: ≈ 1 km
🚗 Average speed: ≈ 45–50 km/h
🌐 Network load: ≈ 5 %
⚙️ Congestion index: ≈ 2 %
💶 Economic cost of delay: ≈ € _ _ _ _ to be determined
♻️ Emission intensity: Baseline
🚲 Modal opportunity rate: Maximum — perfect early cycling conditions
Interpretation: a quiet, free-flowing start; ideal pre-peak conditions across the capital’s entry axes.
06:30 — Initial Compression
Congestion begins forming along the A3 and A4 corridors toward Gasperich and Leudelange; inbound traffic density increases sharply.
Network Overview
🛑 Incidents: 1
⏱ Total delay: ≈ 12 min
📏 Congested distance: ≈ 4 km
🚗 Average speed: ≈ 35–40 km/h
🌐 Network load: ≈ 10 %
⚙️ Congestion index: ≈ 8 %
💶 Economic cost: ≈ € _ _ _ _ to be determined
♻️ Emission intensity: +5 %
🚲 Modal opportunity rate: High with strong comparative advantage for bicycling and trams
Interpretation: the first compression wave moves northward; predictable onset of the daily peak window.
06:49 — Early Congestion Expansion
The congestion pattern broadens westward and southward. Delays form along A6 (Steinfort–Capellen), A4 (Lankelz–Pontpierre), A13 (Hellange–Bettembourg), and A31/A3 (Kanfen–Roeser). The compression wave begins to consolidate toward Ville de Luxembourg.
Network Overview
🛑 Incidents: 4 (+3 vs 06:30)
⏱ Total delay: ≈ 35 min
📏 Congested distance: ≈ 10 km
🚗 Average speed: ≈ 30–40 km/h
🌐 Network load: ≈ 20 %
⚙️ Congestion index: ≈ 15 %
💶 Economic cost: ≈ € _ _ _ _ to be determined
♻️ Emission intensity: +10 %
🚲 Modal opportunity rate: High as city-core mobility unaffected, strong tram advantage
Interpretation: by 06:49, the “red zone” ring is visible around the capital; western and southern approach corridors slow markedly.
07:33 — Urban Core Saturation
By mid-peak, the full compression envelope is visible. Major approach routes and urban arteries experience uniform congestion. The A3, A4, A6, and N3 corridors carry the brunt of the morning load.
Network Overview
🛑 Incidents: 18
⏱ Total delay: ≈ 140 min
📏 Congested distance: ≈ 38 km
🚗 Average speed: ≈ 18–25 km/h
🌐 Network load: ≈ 40 %
⚙️ Congestion index: ≈ 32 %
💶 Economic cost: ≈ € _ _ _ _ to be determined
♻️ Emission intensity: +45 %
🚲 Modal opportunity rate: Moderate as tram and bicycle flow stable; car network near-saturation
Interpretation: peak compression achieved; A3–A6 act as primary bottlenecks feeding the capital’s interior.
07:46 — Congestion Plateau
Traffic conditions stabilize at the morning peak. Parking data show saturation near city center (Théâtre, Brasserie full; Kneudler 72% full).
Network Overview
🛑 Incidents: 19
⏱ Total delay: ≈ 142 min
📏 Congested distance: ≈ 38 km
🚗 Average speed: ≈ 18–22 km/h
🌐 Network load: ≈ 43 %
⚙️ Congestion index: ≈ 34 %
💶 Economic cost: ≈ € _ _ _ _ to be determined
♻️ Emission intensity: +48 %
🚲 Modal opportunity rate: Moderate as bicycling retains punctuality edge, particularly in Clausen, Pfaffenthal, and Limpertsberg
Interpretation: system at critical load; the “red ring” around Ville de Luxembourg tightens fully.
08:03 — Beginning of Relief
Traffic congestion slowly begins to recede from outer corridors. Key bottlenecks persist on the A3, A4, and N7 but queue lengths shorten measurably.
Network Overview
🛑 Incidents: 8 (−11 vs 07:46)
⏱ Total delay: ≈ 83 min
📏 Congested distance: ≈ 23 km
🚗 Average speed: ≈ 20–25 km/h
🌐 Network load: ≈ 23 %
⚙️ Congestion index: ≈ 18 %
💶 Economic cost: ≈ € _ _ _ _ to be determined
♻️ Emission intensity: +28 %
🚲 Modal opportunity rate: Rising as strong advantage returns to soft mobility
Interpretation: the green window begins to reopen; recovery visible in northern and central districts.
08:33 — Rapid Recovery Phase
Network resilience asserts itself; vehicle flow reestablishes. Free-flowing sections dominate outside the capital ring.
Network Overview
🛑 Incidents: 5
⏱ Total delay: ≈ 40 min
📏 Congested distance: ≈ 12 km
🚗 Average speed: ≈ 25–30 km/h
🌐 Network load: ≈ 15 %
⚙️ Congestion index: ≈ 9 %
💶 Economic cost: ≈ € _ _ _ _ to be determined
♻️ Emission intensity: +15 %
🚲 Modal opportunity rate: High with tram and bicycle corridors back to nominal efficiency
Interpretation: urban air permeability improves rapidly; network entering normalization.
09:15 — Late-Window Stabilization
Residual delays limited to industrial or suburban sectors. City center (Ville Haute–Gare–Hollerich) functionally clear.
Network Overview
🛑 Incidents: 12 (−5 vs 08:03)
⏱ Total delay: ≈ 68 min (−74 min)
📏 Congested distance: ≈ 19 km (−21 km)
🚗 Average speed: ≈ 18–25 km/h (stable)
🌐 Network load: ≈ 25 % (−15 pts)
⚙️ Congestion index: ≈ 13 %
💶 Economic cost: ≈ € _ _ _ _ to be determined
♻️ Emission intensity: +18 %
🚲 Modal opportunity rate: Very high with network coherence re-established
Interpretation: residual pressure spots persist along N7, N4, and A3 industrial zones, but general fluidity restored.
09:37 — Dissolution of the Peak Wave
The morning congestion wave fully recedes by 09:30; the network regains permeability.
Only residual bottlenecks remain north and southwest of Luxembourg City — industrial corridors and regional commuting routes.
Network Overview
🛑 Incidents: 3 (−27 vs 08:03)
⏱ Total delay: ≈ 9 min (−133 min)
📏 Congested distance: ≈ 3 km (−34 km)
🚗 Average speed: ≈ 20 km/h (steady vs earlier congested corridors)
🌐 Network load: ≈ 8 % (−32 pts vs 07:46 peak)
⚙️ Congestion index: ≈ 4 %
💶 Economic cost: ≈ € _ _ _ _ to be determined
♻️ Emission intensity: +5 %
🚲 Modal opportunity rate: Maximal with all soft modes at full advantage
Interpretation: city core returns to free-flow; bicycle and tram networks dominate short-distance mobility; automotive congestion dissipates.
For your further consideration:
The 2012 JRC Scientific and Policy Reports’ PDF: Measuring road congestion by Panayotis Christidis and Juan Nicolás Ibáñez Rivas
- A lot of car-LINK math and not city math. Studies including the 2012 JRC paper measure congestion as link speeds versus “free-flow” and minutes of delay per kilometer. Such studies says little about people moved, access to opportunity, safety, street life, or induced demand. Such studies cannot tell you whether a city is THRIVING . . . or focused on moving metal boxes on wheels. Such studies are historically “useful” to understand the present . . . and they are strategically dated. The probe-speed method (TomTom 2008–09; published 2012) is fine for mapping hot-spots, but does not grapple with the last decade’s core lessons learned: induced demand; lifecycle maintenance debt; and the fiscal productivity of street space. One mode = one answer: remedies implied revolve around traffic management; pricing; and capacity tweaks. One mode “remedies” miss mode shift, street reallocation, network permeability for walking, bicycling . . . and multi-modal public transit. Worst of all: one-mode “remedies” underplay the cost of keeping expanded road assets solvent.
NEEDED: Holistic Systems Thinking that treats Traffic Congestion as a symptom . . . and not as the disease. Consider the framing that analyst Jason Slaughter highlights in Not Just Bikes — “Would You Fall for It?” . . . which asks profound questions about:
- Induced demand: building and widening more roads midwifes more driving. The “free-flowing channels of concrete and steel” quickly congest again. The fix? Competitive multi-modal alternatives . . . at scale.
- Lifecycle costs: the first road-resurfacing and rehab wave are necessary ~30 years after construction . . . and the road-maintenance liability often exceeds road-build cost. Result: debt-financed highway expansion hollows out municipal balance sheets.
- Stroads versus streets and roads: hybrid “do-everything” arterial roads destroy communities . . . and still move traffic poorly. Why? Because they throttle traffic and local commerce while being expensive to maintain.
- Opportunity cost of land: a block of freeway or parking replaces a block of resilient taxable homes and shops. Result: near-term speed traded for long-term fiscal drag.
- Governance and incentives: fragmented funding hides true costs as non-drivers subsidize road-heavy systems. Outcome = car dependency with weak resilience.
- Questions? Would you like to discuss? Contact Youth4Planet’s C.A.T. (Climate Action Tiger) and Y4P Ambassador Christian Thalacker for feedback: christian@youth4planet.org